PROSESS OUTPUT Format
Every PROSESS output is divided into four "clickable" pages: 1) Global Structure Assessment; 2) Local (Per-residue) Structure Assessment; 3) Graphs and Figures and 4) Similarity Assessment.
|
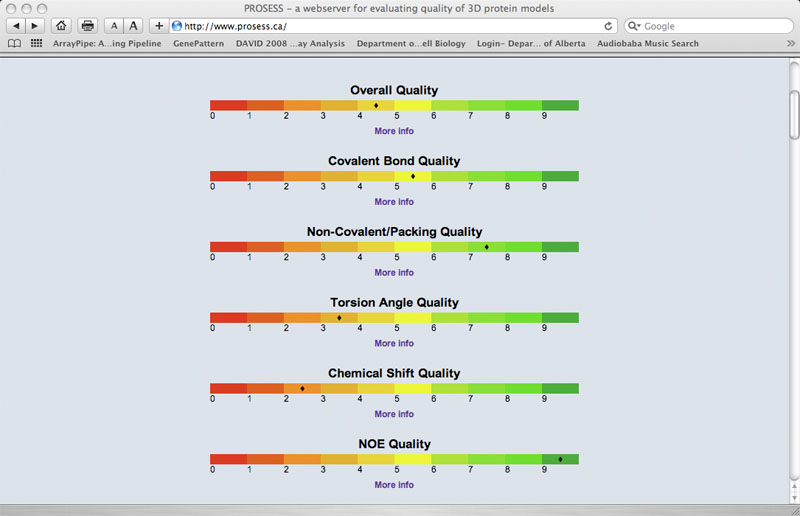
Global Structure Assessment - Colored Bars
This provides users with numerical (0-10) and color-coded assessments of the structure quality. These red-amber-green (RAG) color bars are intended to provide users with a quick overview of the protein's structure from the perspective of its 1) overall quality; 2) covalent and geometric quality; 3) non-covalent/packing quality; 4) torsion angle quality; 5) chemical shift quality and 6) NOE quality.
|
|
Global Structure Assessment - Tabular output
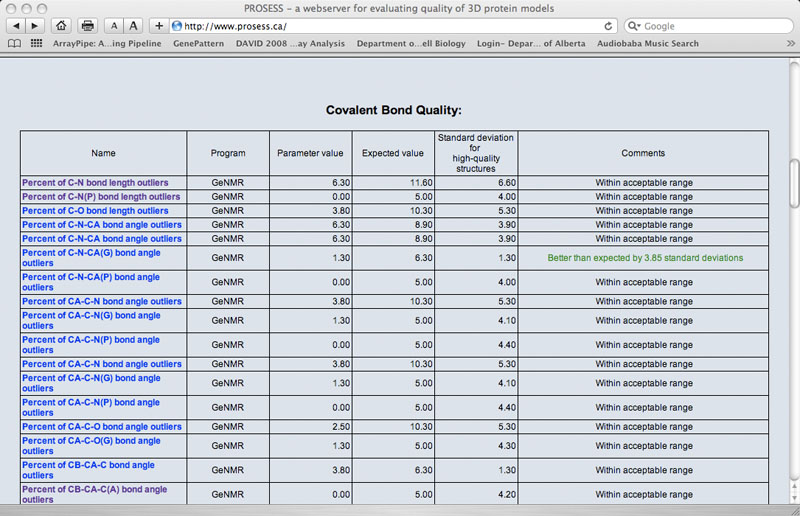
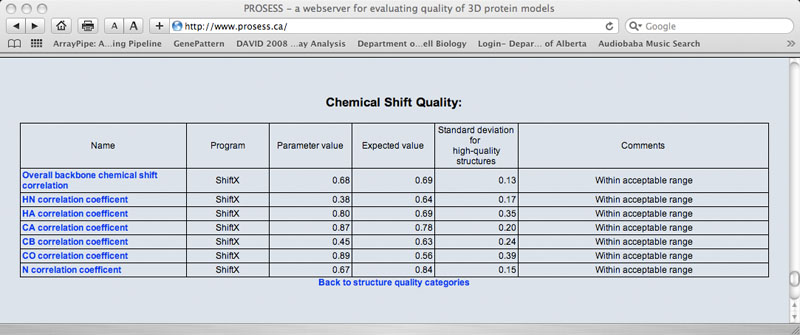
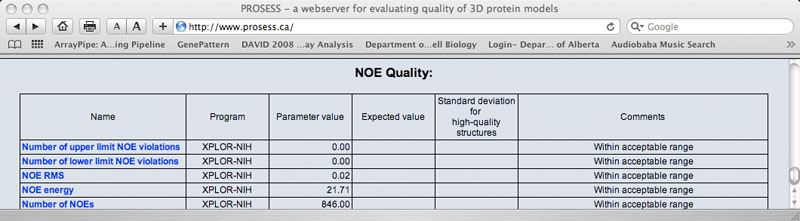
The Global Structure Assessment page lists more than 90 calculated parameters that are broadly grouped into five general categories (covalent, non-covalent, torsion, chemical shift and NOE). Each parameter is hyperlinked to a brief explanation of that parameter. The name of the program used to calculate that parameter is also provided. The value for the protein of interest is provided along with an expected value and a standard deviation determined from a set of 1000 high-resolution (<2.0 Ao resolution) X-ray structures. If the calculated value is more than 2 standard deviations larger than the ideal value it is flagged with red comment. If the calculated value is more than 2 standard deviations below the ideal value it is flagged with a green comment. Values that are within acceptable limits (< 2 SD) are colored black.
|
Sample Covalent Quality Table
|
|
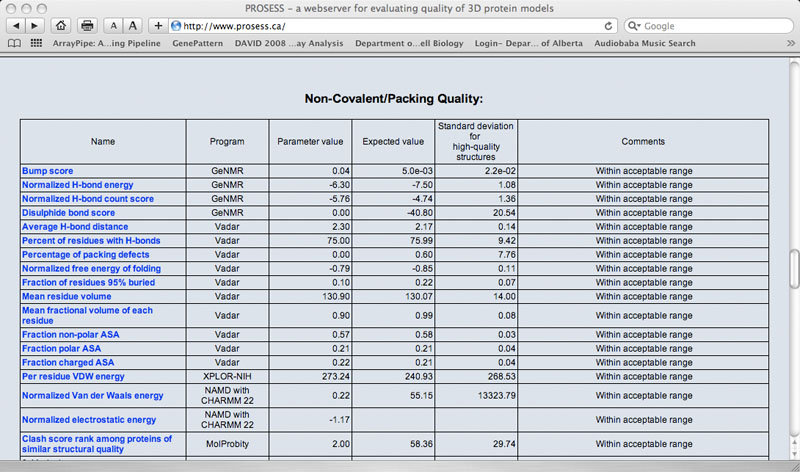
Sample Non-covalent Quality Table
|
|
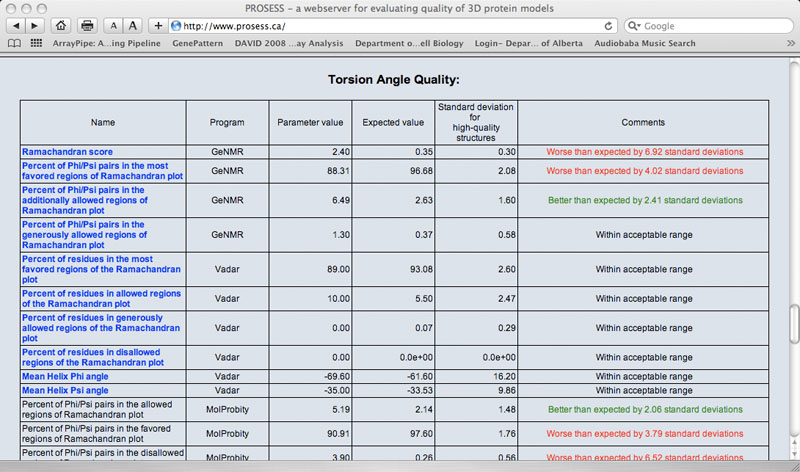
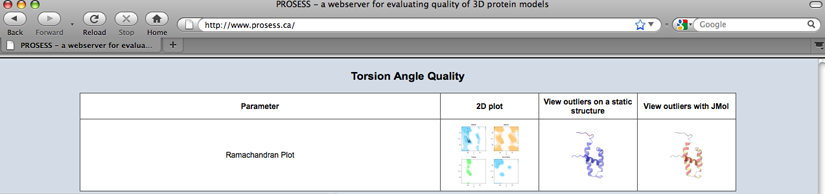
Sample Torsion Angle Quality Table
|
|
Sample Chemical Shift Quality Table
|
|
Sample NOE Quality Table
|
|
Local (Per-residue) Structure Assessment Page - Tabular Output
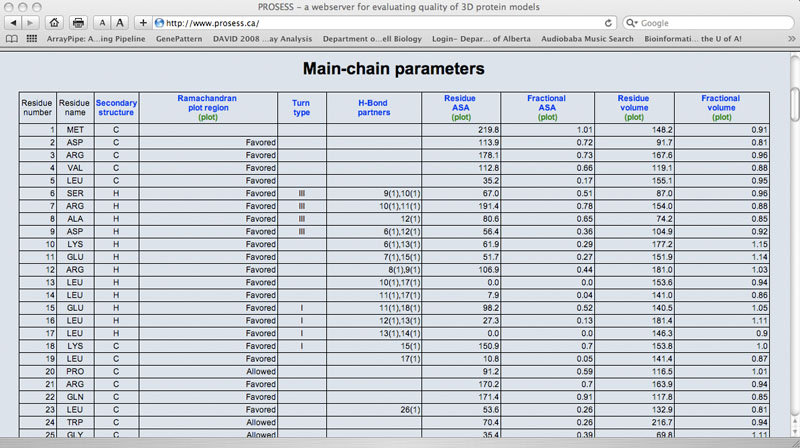
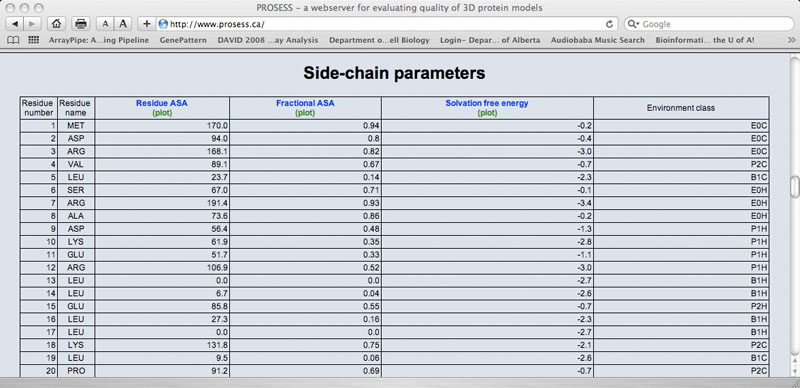
The Local Structure Assessment page provides tables that assess the residue-specific properties of the protein. Each residue is listed in a row and each property assessment is listed in a column. As with the Global Structure Assessment tables, short descriptions for each property or parameter are hyperlinked to the name of that parameter. Each column is also hyperlinked to a corresponding graph. Several sets of local structure assessments are provided including: 1) main chain parameters 2) side chain parameters; 3) chemical shift comparisons; 4) a residue-specific evaluation of flexibility/mobility and 5) an evaluation of residue-specific NOE violations. Values that exceed normally allowable limits are colored red.
|
Sample Main Chain Table
|
|
Sample Side Chain Table
|
|
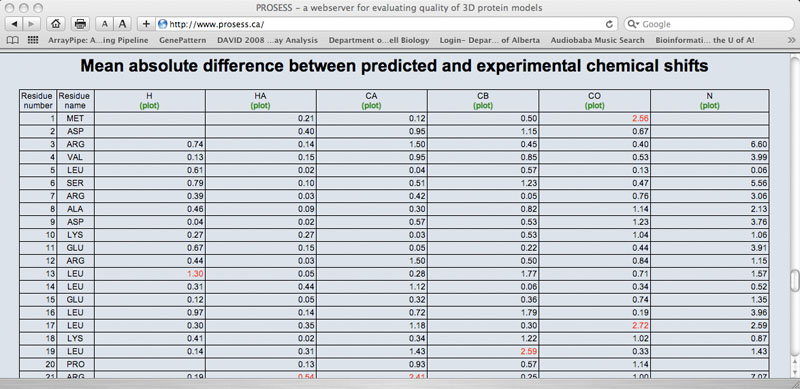
Sample Chemical Shift Comparison Table
|
|
Graphs and Figures Page
The Graphs and Figures (G & F) page provides a variety of visual output that summarizes the results from both the Global and Local Structure Assessment pages. At the top of each G & F page is the standard set of red-amber-green bars. Below these synoptic bars is a set of thumbnail images and short titles so that users can navigate to different images, graphs or plots.
|
G & F - Colored Bars
These red-amber-green (RAG) color bars are intended to provide users with a quick overview of the protein's structure from the perspective of its 1) overall quality; 2) covalent and geometric quality; 3) non-covalent/packing quality; 4) torsion angle quality; 5) chemical shift quality and 6) NOE quality.
|

|
Sample Thumbnail Images/Table
|
|
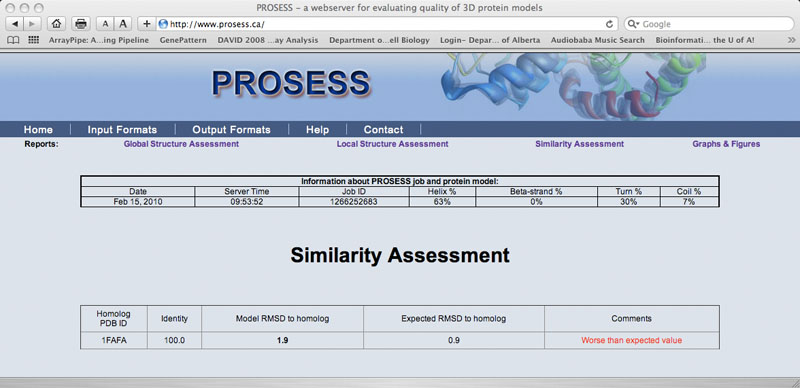
Similarity Assessment Page
The Similarity Assessment page summarizes the results of BLAST searches of the protein sequence against the PDB. Those structures with Expect values <10-7 are listed, along with their resolution/Rfree values (if available). The calculated RMSD between the input structure and the related structures is calculated and displayed. Those structures that are significantly different from related structures (according to their RMSD and sequence identity) are flagged. The purpose of the Similarity Assessment page is to help users identify if their structure is already similar to something already solved and if it is, whether there may be structural differences that may be cause for concern.
|
|