Short Tutorial:
(How can PROSESS help to evaluate protein global quality and identify local difects.)
Step 1. Evaluate overall quality
|
After submitting your protein PDB file and allowing PROSESS to process your file, the first step involves
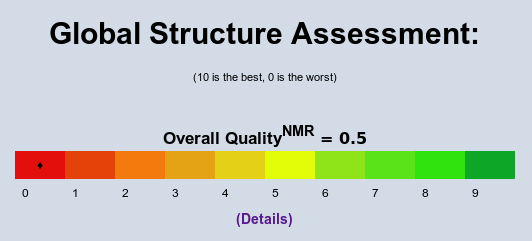
Inspecting the Overall Quality Index shown under "Global Structure Assessment". For PROSESS the
structure quality is indicated by both a number (between 0 and 10) and a red-amber-green (RAG) color bar,
with green being excellent and red being poor. Indices between 7 and 10 generally indicate that the protein
overall structure quality is good to excellent. Indices between 4 and 7 are typical for proteins where the
overall structure quality is mediocre to tolerable. If the Overall Quality Index is below 8, you should go to
Step 2. If you want to know how the Overall Quality Index was calculated, click on the "Details" link.
|
Example of poor Overall Quality Index:
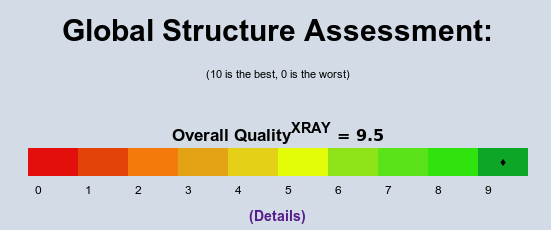
Example of good Overall Quality Index:
Step 2. Inspect global quality categories
|
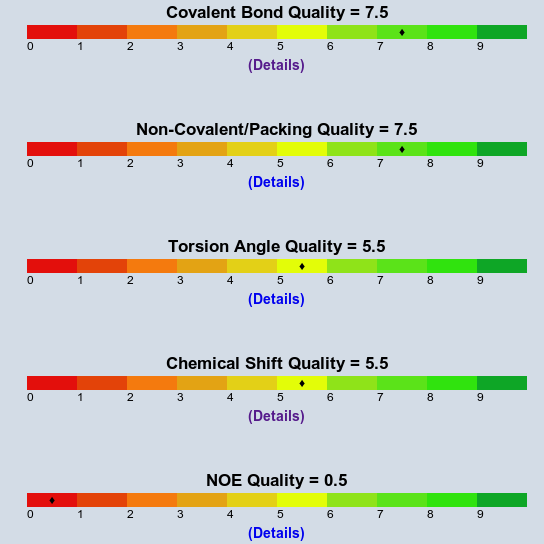
In this step, users should assess the Category Quality Indices by looking at individual global quality
categories listed under "Global Structure Assessment". Indices between 7 and 10 can be interpreted as
indicating that the protein structur is good to excellent in this category. Indices between 4 and 7 indicate
the protein is only mediocre to tolerable, in this category. Query proteins scoring below 4 in a given category
likely have some serious problems. As a general rule, for those categories with quality indices below 8, it is
a good idea to inspect individual Score Quality Indices that were combined to generate each global quality
index. Click on the "Details" links below corresponding RAG scales to proceed to the Score Quality Indices.
|
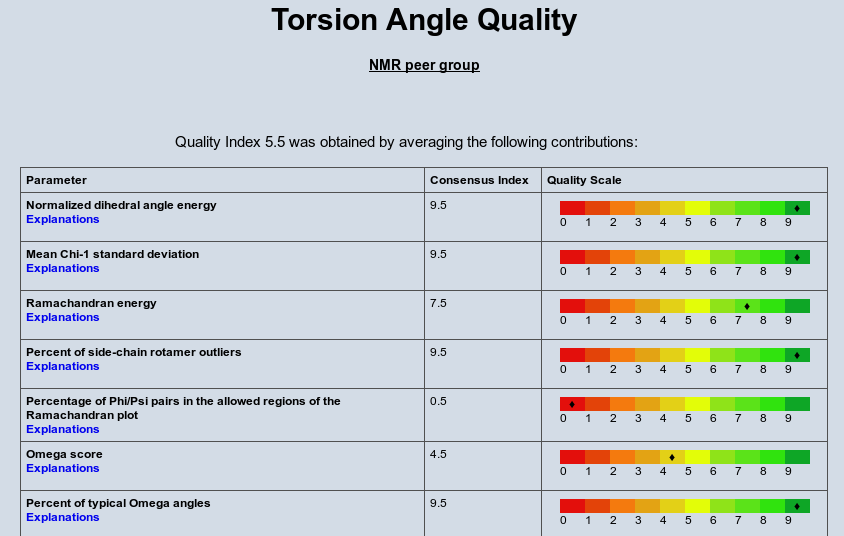
Step 3. Identify protein parameters with poor global quality
|
Evaluate Quality Indices for individual protein parameters by clicking on the "Details" links listed under the
global quality categories on the "Global Structure Assessment" page. Indices between 7 and 10 indicate that
this particular parameter scores between good to excellent. Indices between 4 and 7 indicate that this
particular parameter is only mediocre to tolerable. Values below 4 indicate that the protein has serious
problems with this particular parameter. For those quality categories with indices below 8, it is a good idea
to inspect per-residue outliers on the "Local Structure Assessment" page or/and the "Graphs & Figures"
page. Click on the "Explanations" hyperlink near each score name to find how the score was calculated.
|
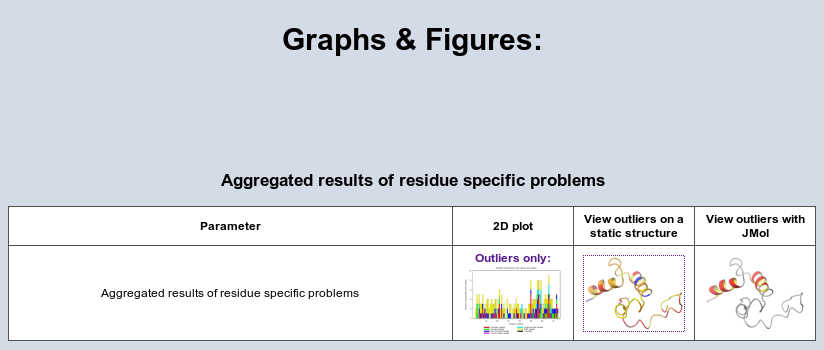
Step 4. Locate clusters of low quality in the 3D structure
|
In this step, users should try to locate clusters of residues along the sequence that exhibit poor structure
quality by inspecting 2D plots and 3D images of the aggregated residue-specific problems that are shown on
the "Graphs & Figures" page.
|
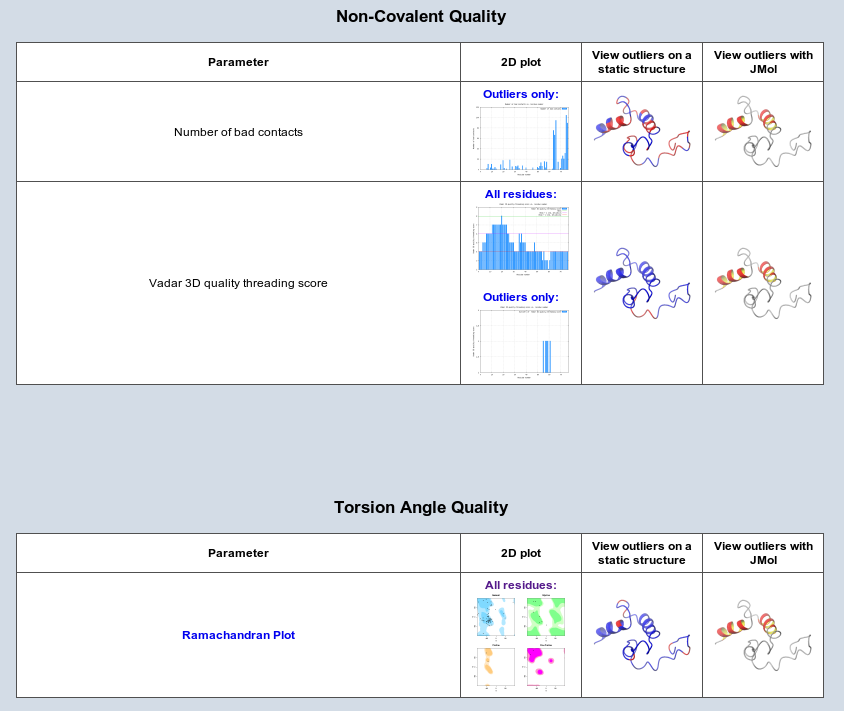
Example of "Graphs & Figures" page layout:
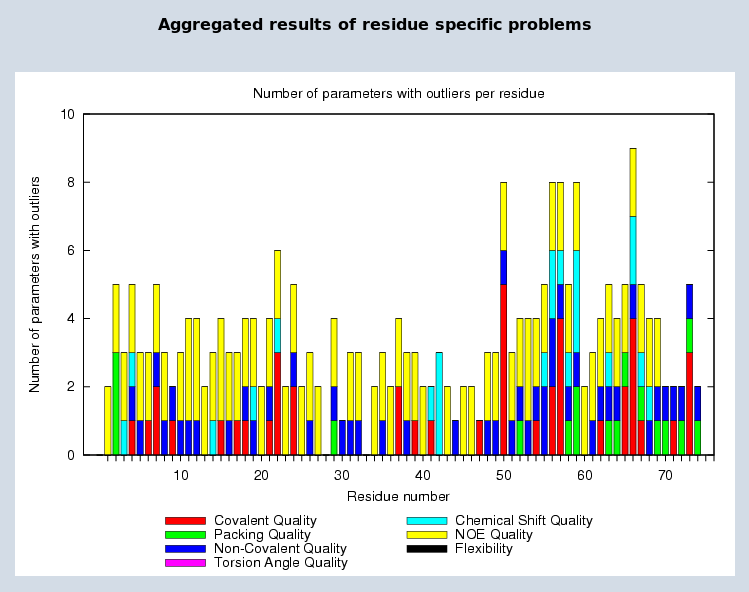
Example of 2D plot of aggregated residue specific structural problems:
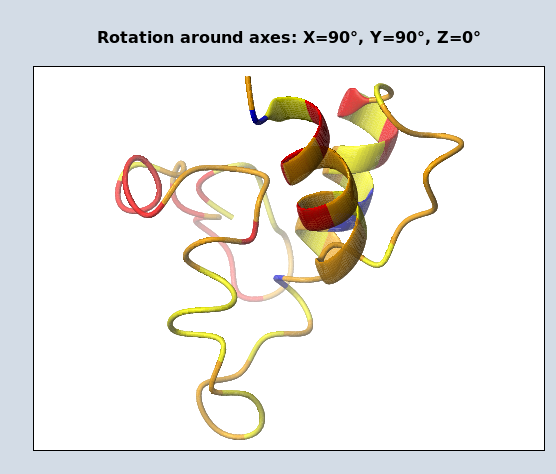
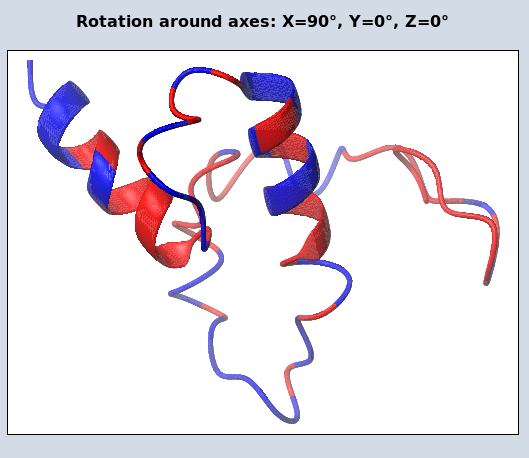
Example of protein static 3D image, colored according to the number of per-residue problems:
Residues with 1-2 problems are colored yellow. Residues
with 3-4 problems are colored orange. Residues with 5 problems and above are colored red. Static images are generated by
MolMol
|
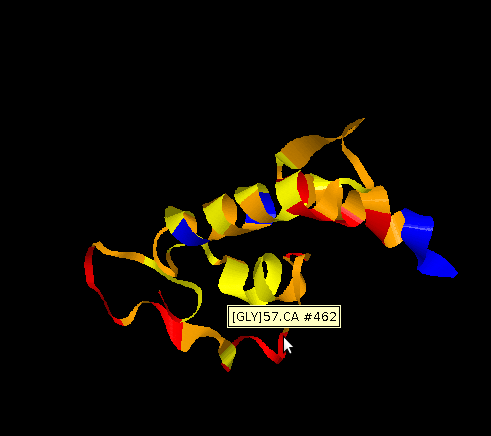
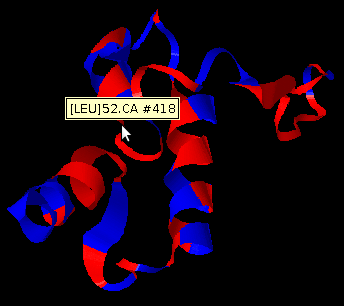
Example of interactive 3D image, colored according to the number of per-residue problems:
|
Residues with 1-2 problems are colored yellow. Residues
with 3-4 problems are colored orange. Residues with 5 problems and above are colored red. PROSESS uses Jmol to create interactive images.
|
Step 5. Inspect outliers of protein parameters
|
In this step, users should review the 2D plots and 3D images displaying structural outliers corresponding to different structure parameters. These can be viewed on the "Graphs & Figures" page. Pay a particular attention to parameters with poor quality indices found in step #3 and protein problem regions identified in
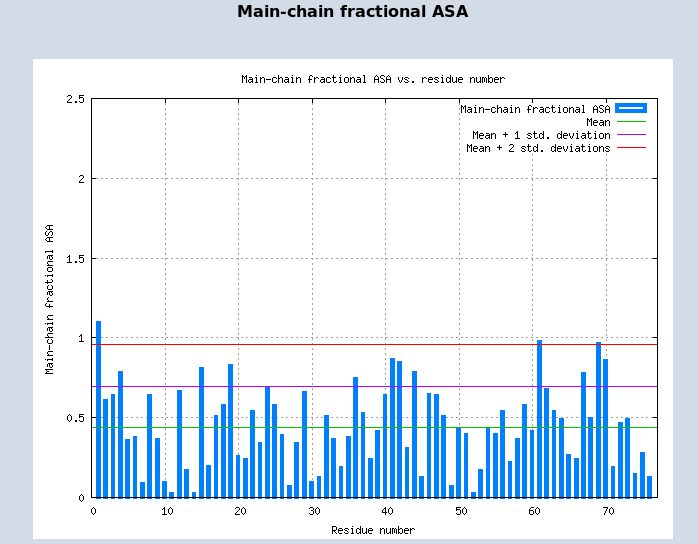
step #4. First, inspect outliers on the "Outliers only" 2D pictures. Second, assess outlier severity by
comparing outlier values with normal values found with other residues. This can be done by looking at the mean (average) values and standard deviations on the "All residues" 2D plots. Third, identify protein regions with the most severe problems by detecting non-sequential outlier clusters (i.e. those regions that are mostly
red) by looking at the static and interactive 3D images of protein structures.
|
Example of "Graphs & Figures" page layout:
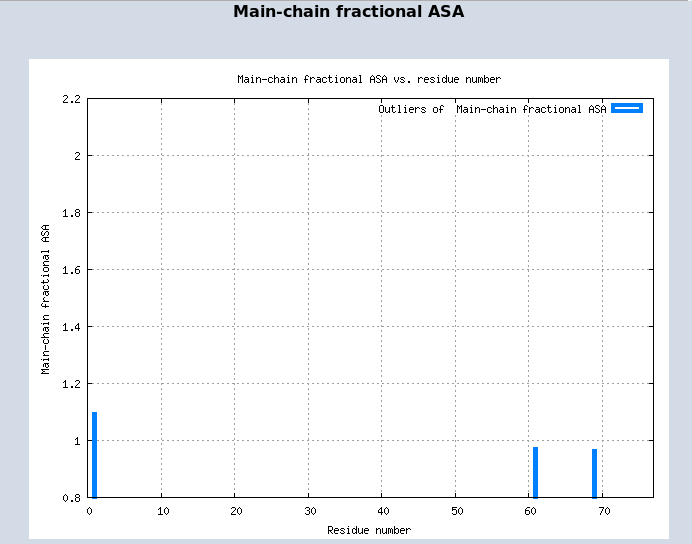
Example of 2D plot showing only outliers of a protein parameter:
Example of 2D plot showing parameters for all residues, mean values and standard deviation thresholds:
Outliers mapped onto a protein static 3D image:
Outlier regions are colored red. Static images are generated with
MolMol
|
Outliers mapped onto a protein interactive 3D image:
|
Outlier regions are colored red. PROSESS uses Jmol to create interactive images.
|
|